Timelines (Gantt Charts)
Visualize project schedules, dependencies, and progress using interactive Gantt charts.
Accessing Timelines
- Navigate to the desired project from the main "Projects" page.
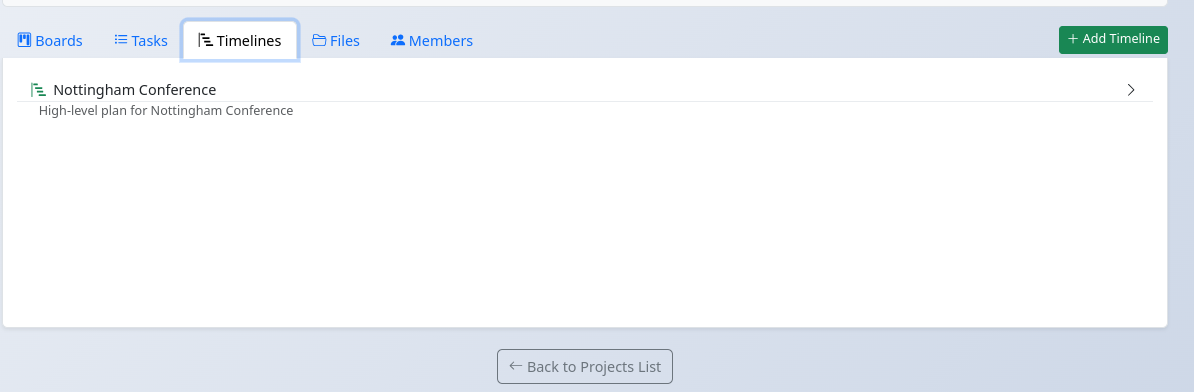
- On the "View Project" page, click the "Timelines" tab.
- You will see a list of Gantt chart timelines created for this project.
- Click on a timeline name to open the Gantt chart view.
Creating a New Timeline
(Requires Editor, Admin, or Owner role)
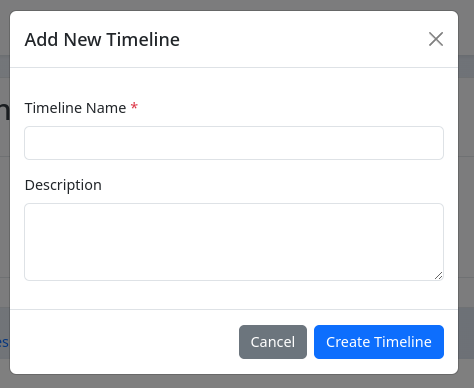
- On the project's "Timelines" tab, click the "Add Timeline" () button.
- Enter a Name for the timeline (required).
- Optionally, add a Description.
- Click "Create Timeline".
You will be redirected to the new timeline's Gantt chart view.
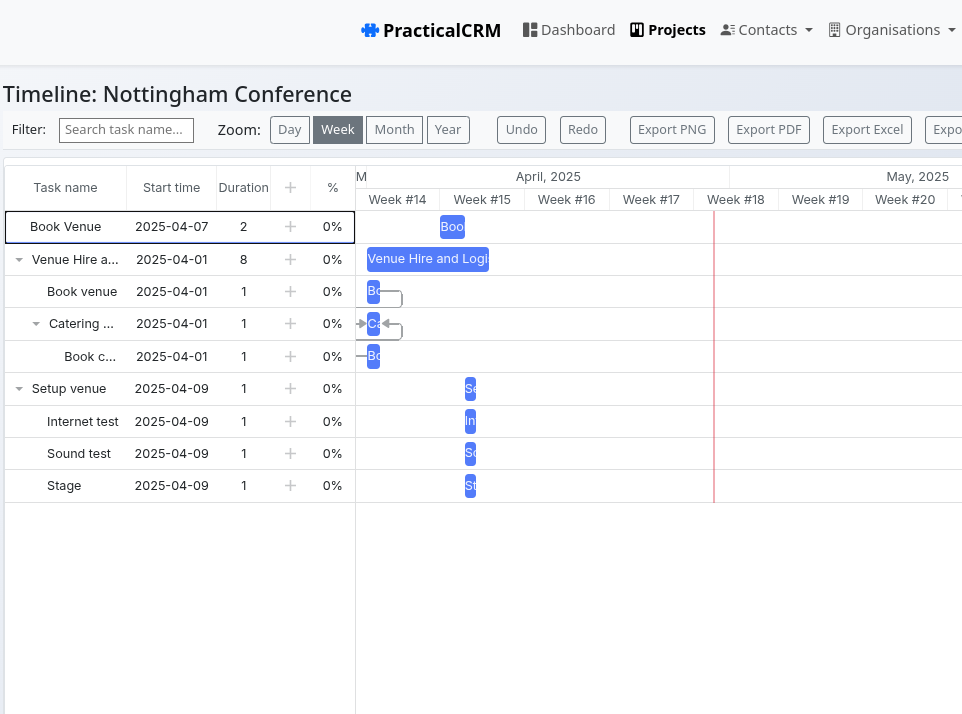
Using the Gantt Chart View
The Gantt chart provides a visual representation of tasks over time.
(Requires Editor, Admin, or Owner role for modifications)
- Adding Tasks: Double-click on an empty row in the grid section (left side) or use the "+" button often found in the grid header/footer (depending on specific library implementation).
- Editing Tasks:
- Double-click on a task name or date cell in the grid to edit it directly.
- Double-click on the task bar in the timeline area (right side) to open a lightbox/modal for detailed editing (Name, Duration, Dates).
- Adjusting Dates/Duration: Drag the ends of a task bar in the timeline to change its duration or drag the entire bar to move its start/end dates.
- Setting Progress: Drag the progress handle (usually a small square or different color section) on the task bar to update its completion percentage. You can also edit the '%' column in the grid.
- Creating Dependencies (Links): Hover near the end of one task bar until a circle appears, then click and drag to the start or end of another task bar to create a dependency link (e.g., Finish-to-Start). Double-click a link line to change its type or add lag.
- Indenting/Outdenting Tasks: Use indent/outdent buttons (if available in the grid toolbar) or drag tasks horizontally in the grid to create parent-child relationships (summary tasks).
- Reordering Tasks: Drag tasks vertically within the grid section to change their display order.
Changes made in the Gantt chart are typically saved automatically.
Toolbar Controls
Above the Gantt chart, you'll find several controls:
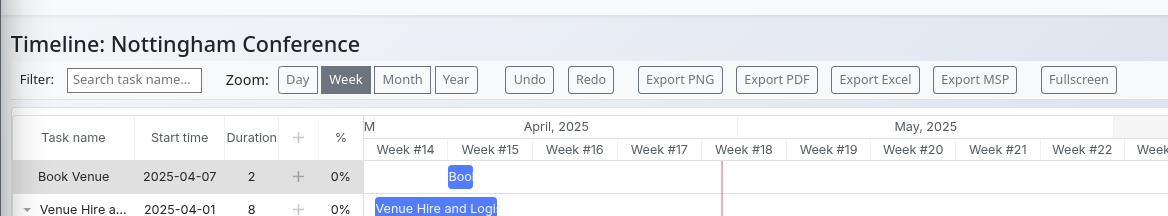
- Filter: Type text to filter tasks shown in the chart by name.
- Zoom: Select Day, Week, Month, or Year view to change the timeline's scale.
- Undo/Redo: Reverse or reapply your recent changes.
- Export: Download the current Gantt view as a PNG image, PDF document, Excel file, or Microsoft Project file (.mpp).
- Fullscreen: Expand the Gantt chart to fill the entire screen for a better view.